Market Data and ResearchReview
Glassnode Review: On-Chain Data Worth Paying For Solo?
We opened a Glassnode Studio account, tried to read the on-chain metrics a casual holder actually cares about, and hit the paywall on the same charts a fund research desk relies on to see whether a personal Advanced subscription earns its $49 a month.
Our verdict
Glassnode's raw data is genuinely deep, over 1,700 metrics across 1,500 assets with up to 15 years of history, and the free charts alone teach more about market structure than most retail dashboards. The catch is that the metrics a serious analysis actually needs, like Net Unrealized Profit/Loss, sit behind the $49-a-month Advanced plan or the custom-priced Professional tier, pricing built for funds and desks rather than someone checking their own portfolio once a week.
Best for: Serious independent researchers willing to pay monthly for metrics beyond basic price charts
- Price
- Free tier; paid plans available
- Made by
- Glassnode
What we liked
- Over 1,700 on-chain and market metrics across 1,500+ assets
- Up to 15 years of history lets you compare a metric across full market cycles
- The public price and volume charts are free and need no signup to browse
- Point-in-time data lets you see exactly what a metric showed on a past date
What held it back
- Core signals like Net Unrealized Profit/Loss sit behind the paid Advanced plan
- There is no free tier for the platform itself, only a separate research newsletter
- Professional pricing is quote-only, which hides the real cost until you ask
- A casual holder gets little extra insight beyond what a free charting site already shows
We logged into Glassnode Studio with no subscription at first, then again after upgrading to Advanced, and tracked exactly which charts changed from a locked padlock to a readable line the moment we paid.
What "1,700 metrics" actually means on screen
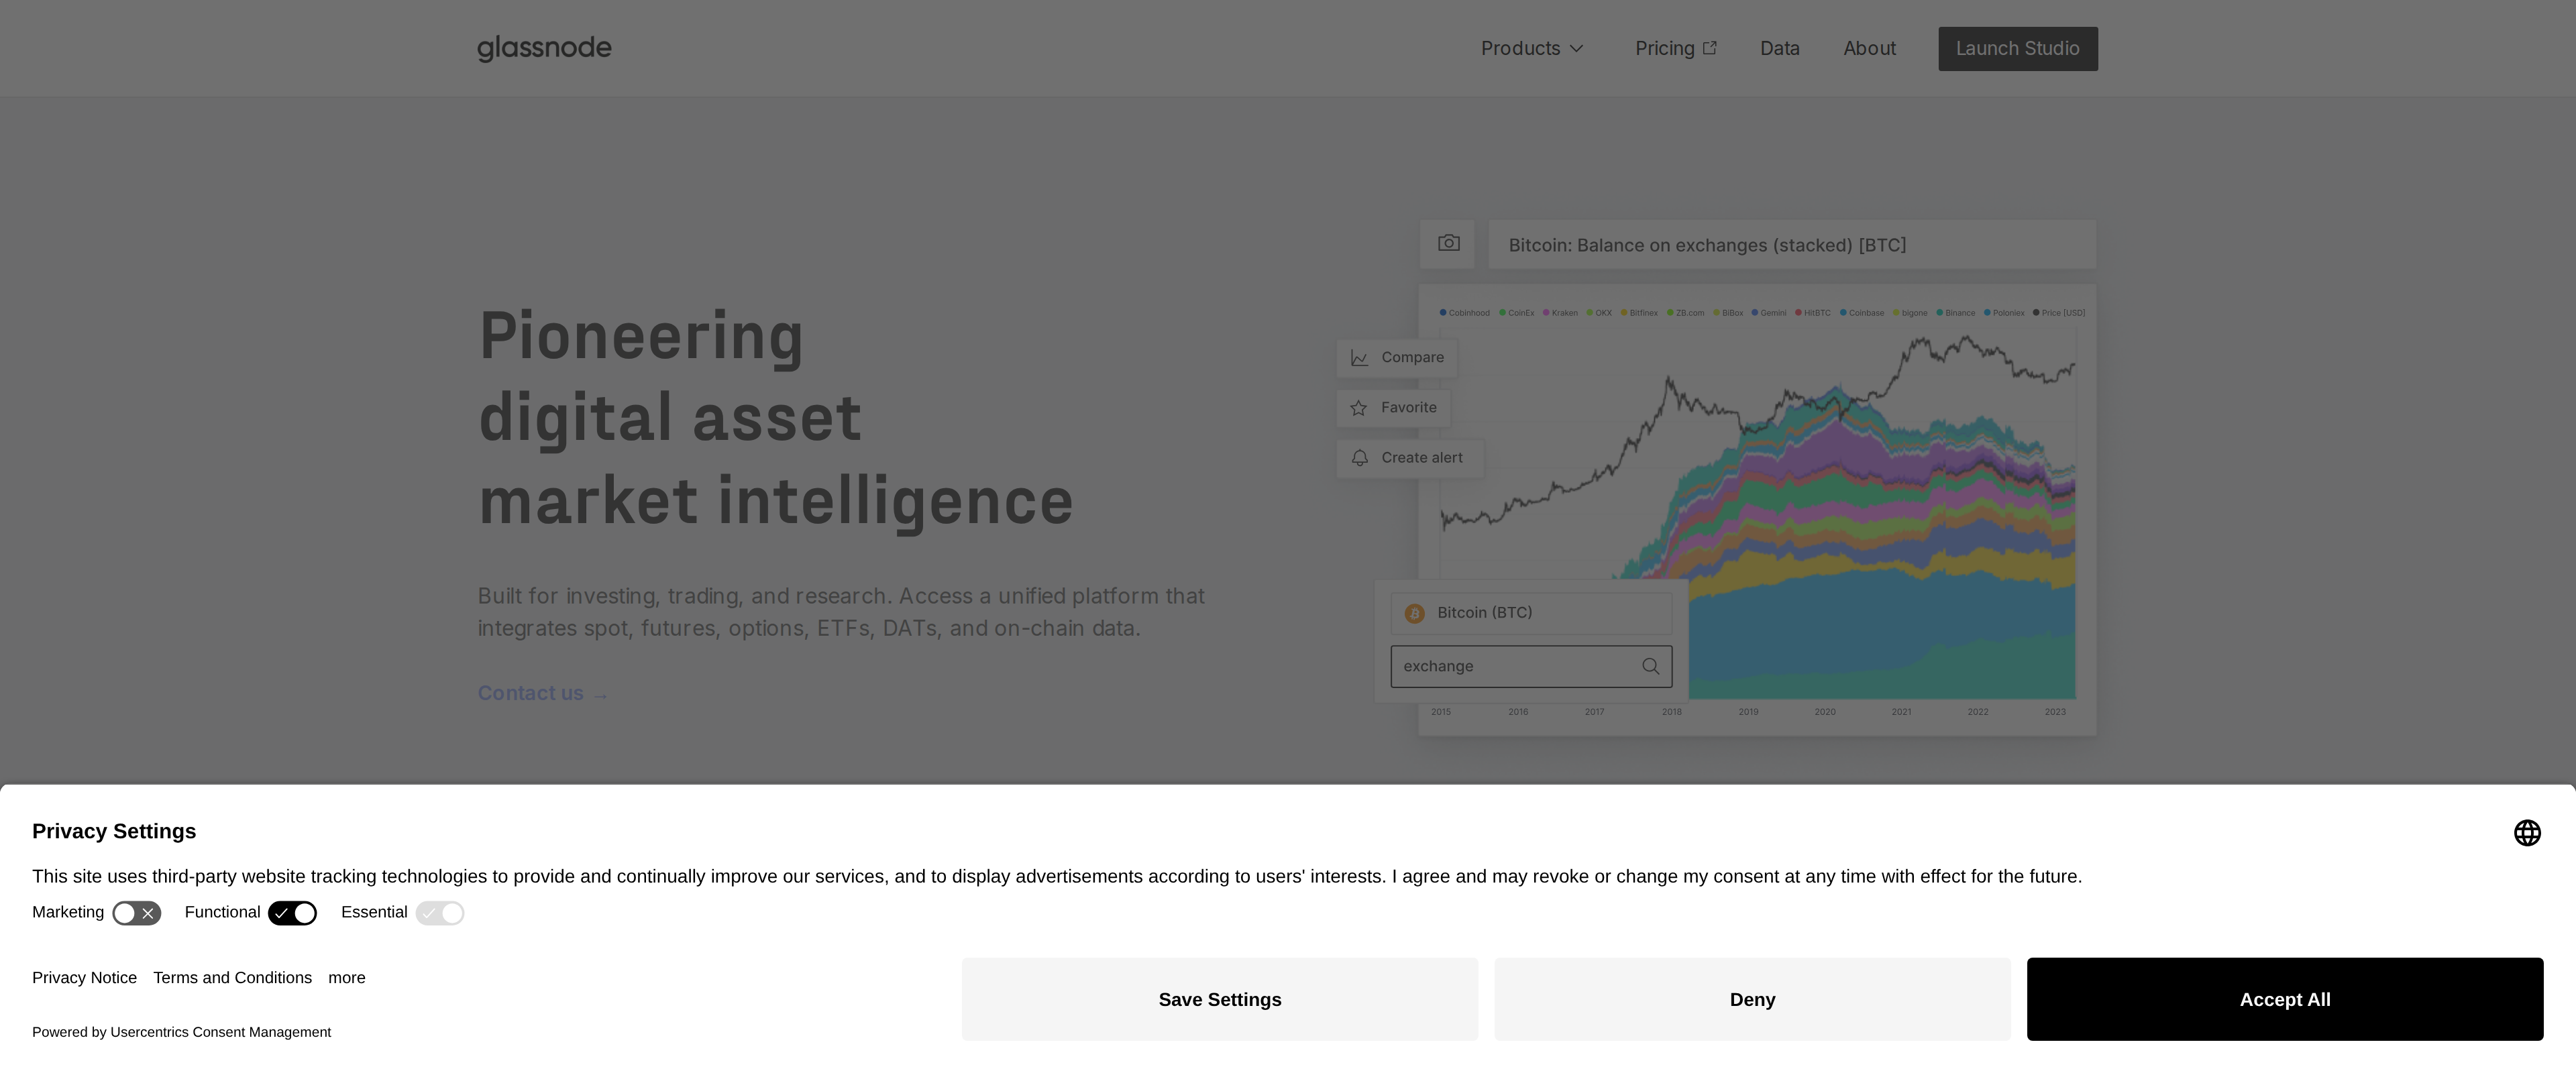
Glassnode's pitch is scale: over 1,700 metrics spanning more than 1,500 assets, some with 15 years of history behind them (glassnode.com). Opening the free charting interface confirms the sidebar is real rather than a marketing number, categories for price, supply, realized profit and loss, exchange flows and dozens more sit there ready to click.
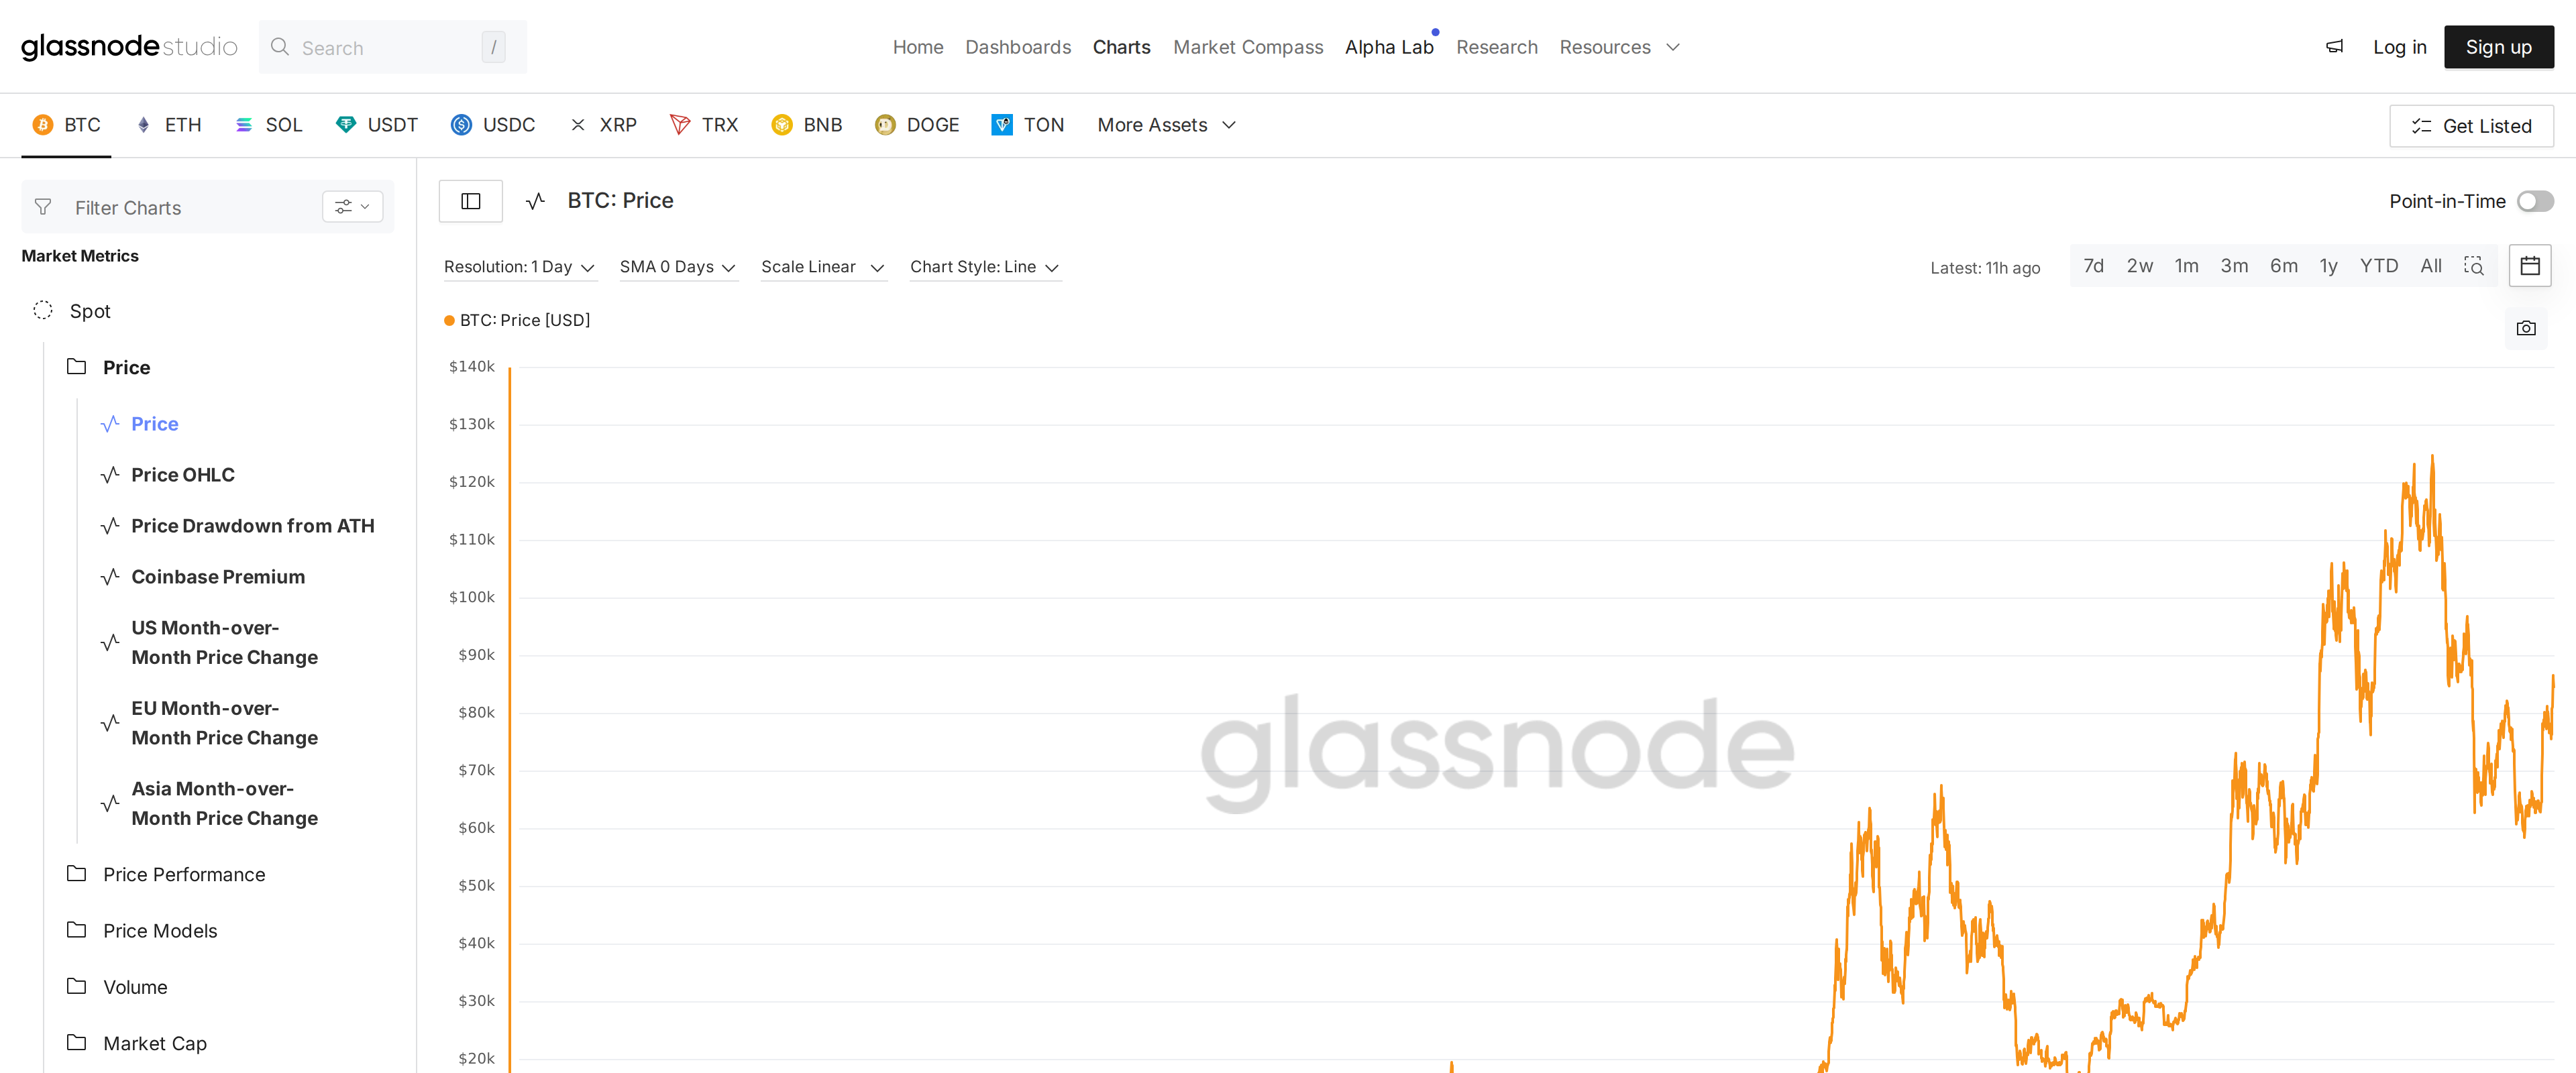
Anyone can browse basic price, volume and market cap charts without an account. That covers what a free service like CoinGecko already shows you, though, so the free tier alone gives a casual holder nothing a simpler tool doesn't.
The paywall sits exactly where the useful data starts
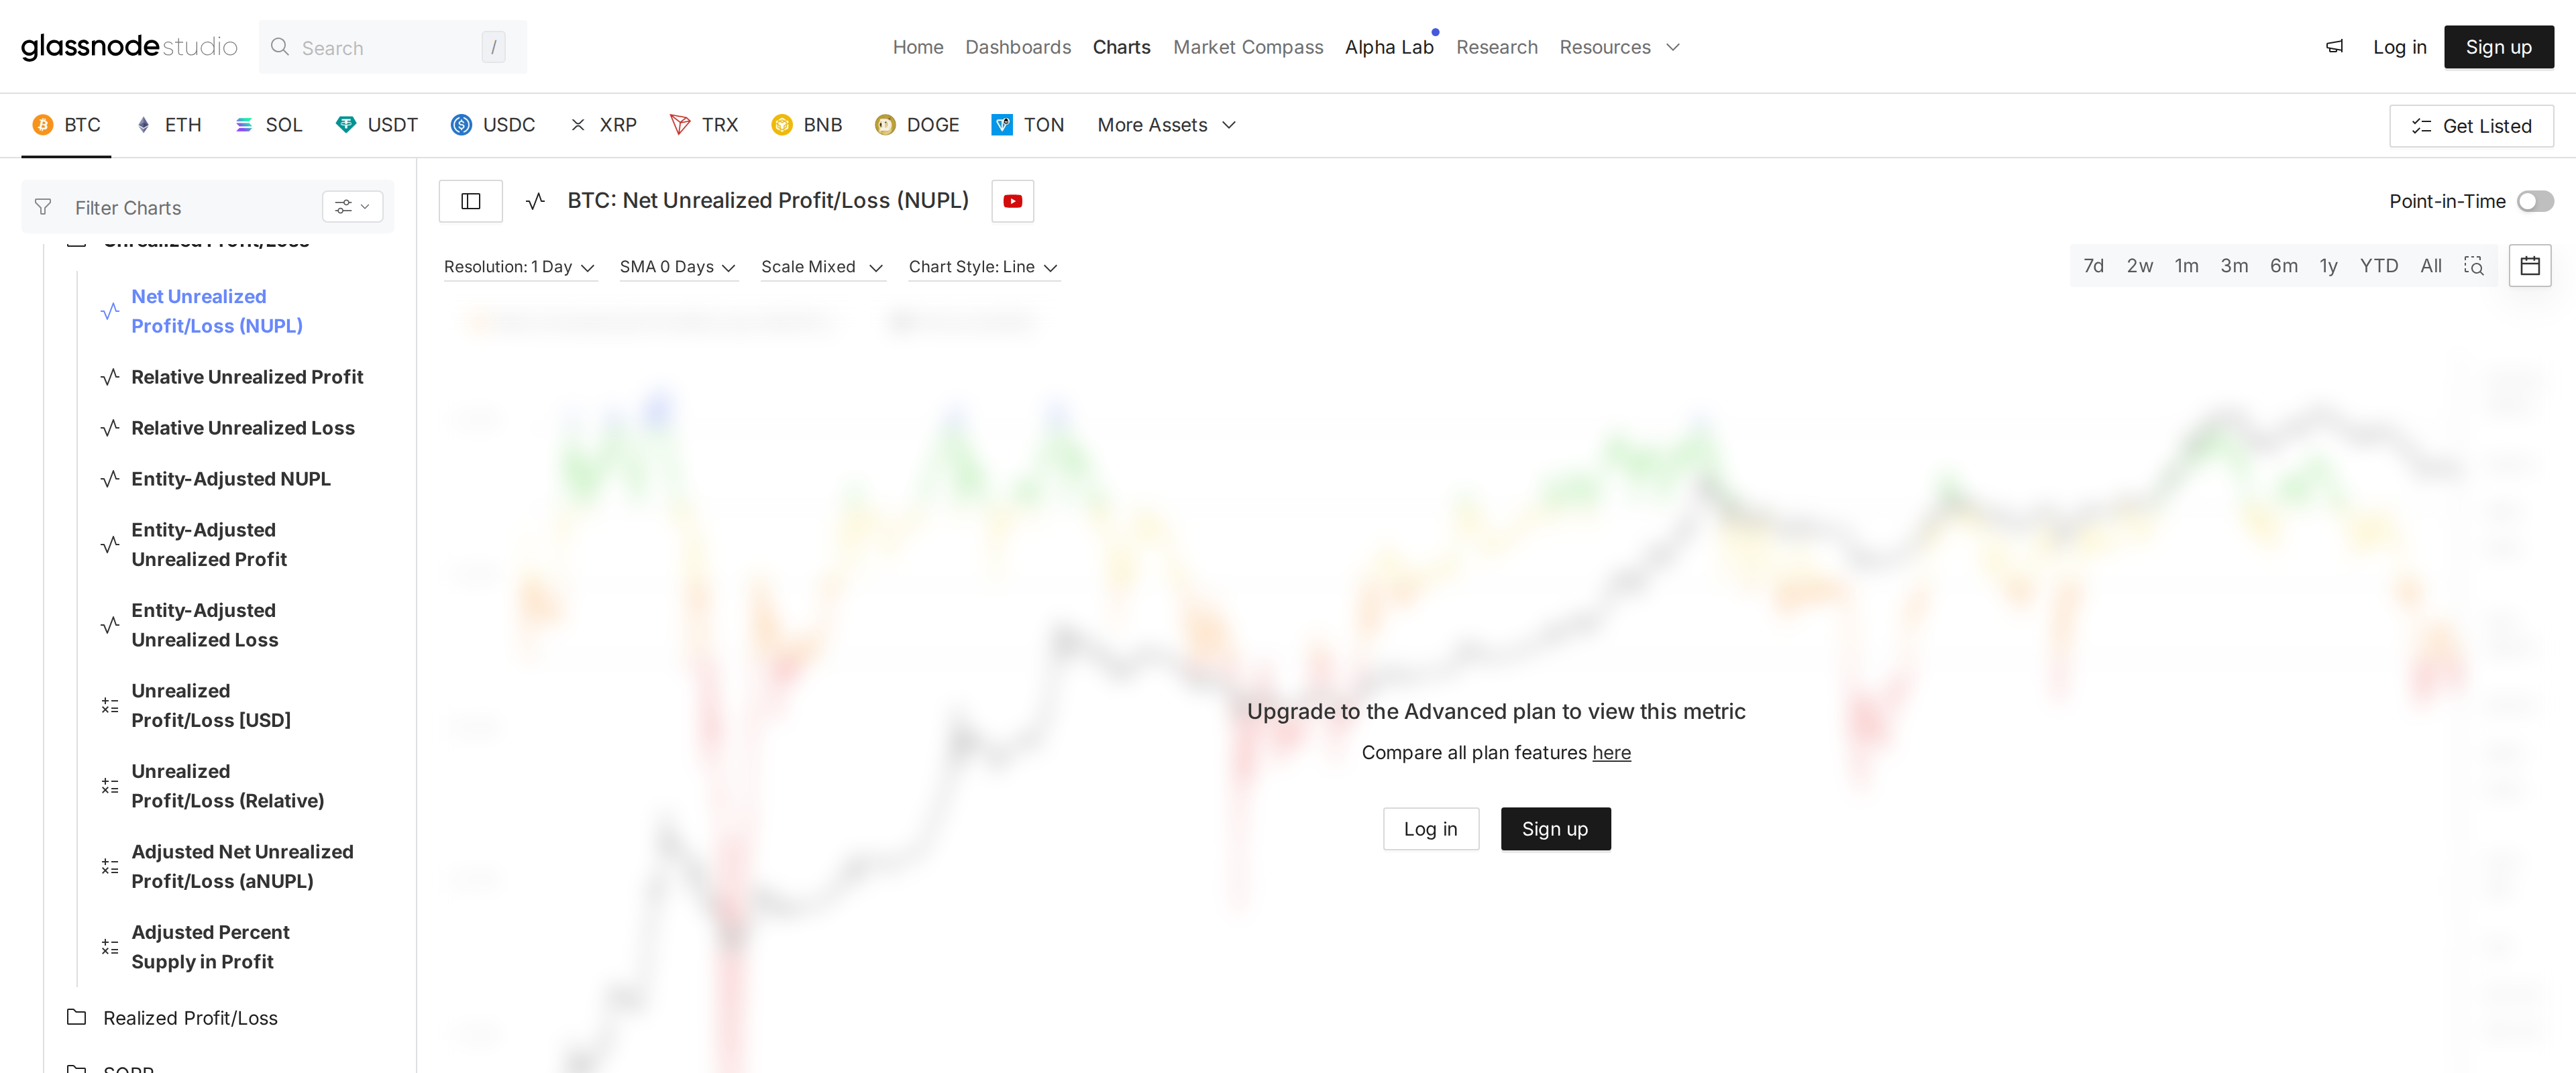
We tried to open Net Unrealized Profit/Loss, a metric professional analysts use to gauge whether the market as a whole is sitting on gains or losses, and hit a hard wall: "Upgrade to the Advanced plan to view this metric." No preview, no delayed data, just a locked chart and a sign-up button.
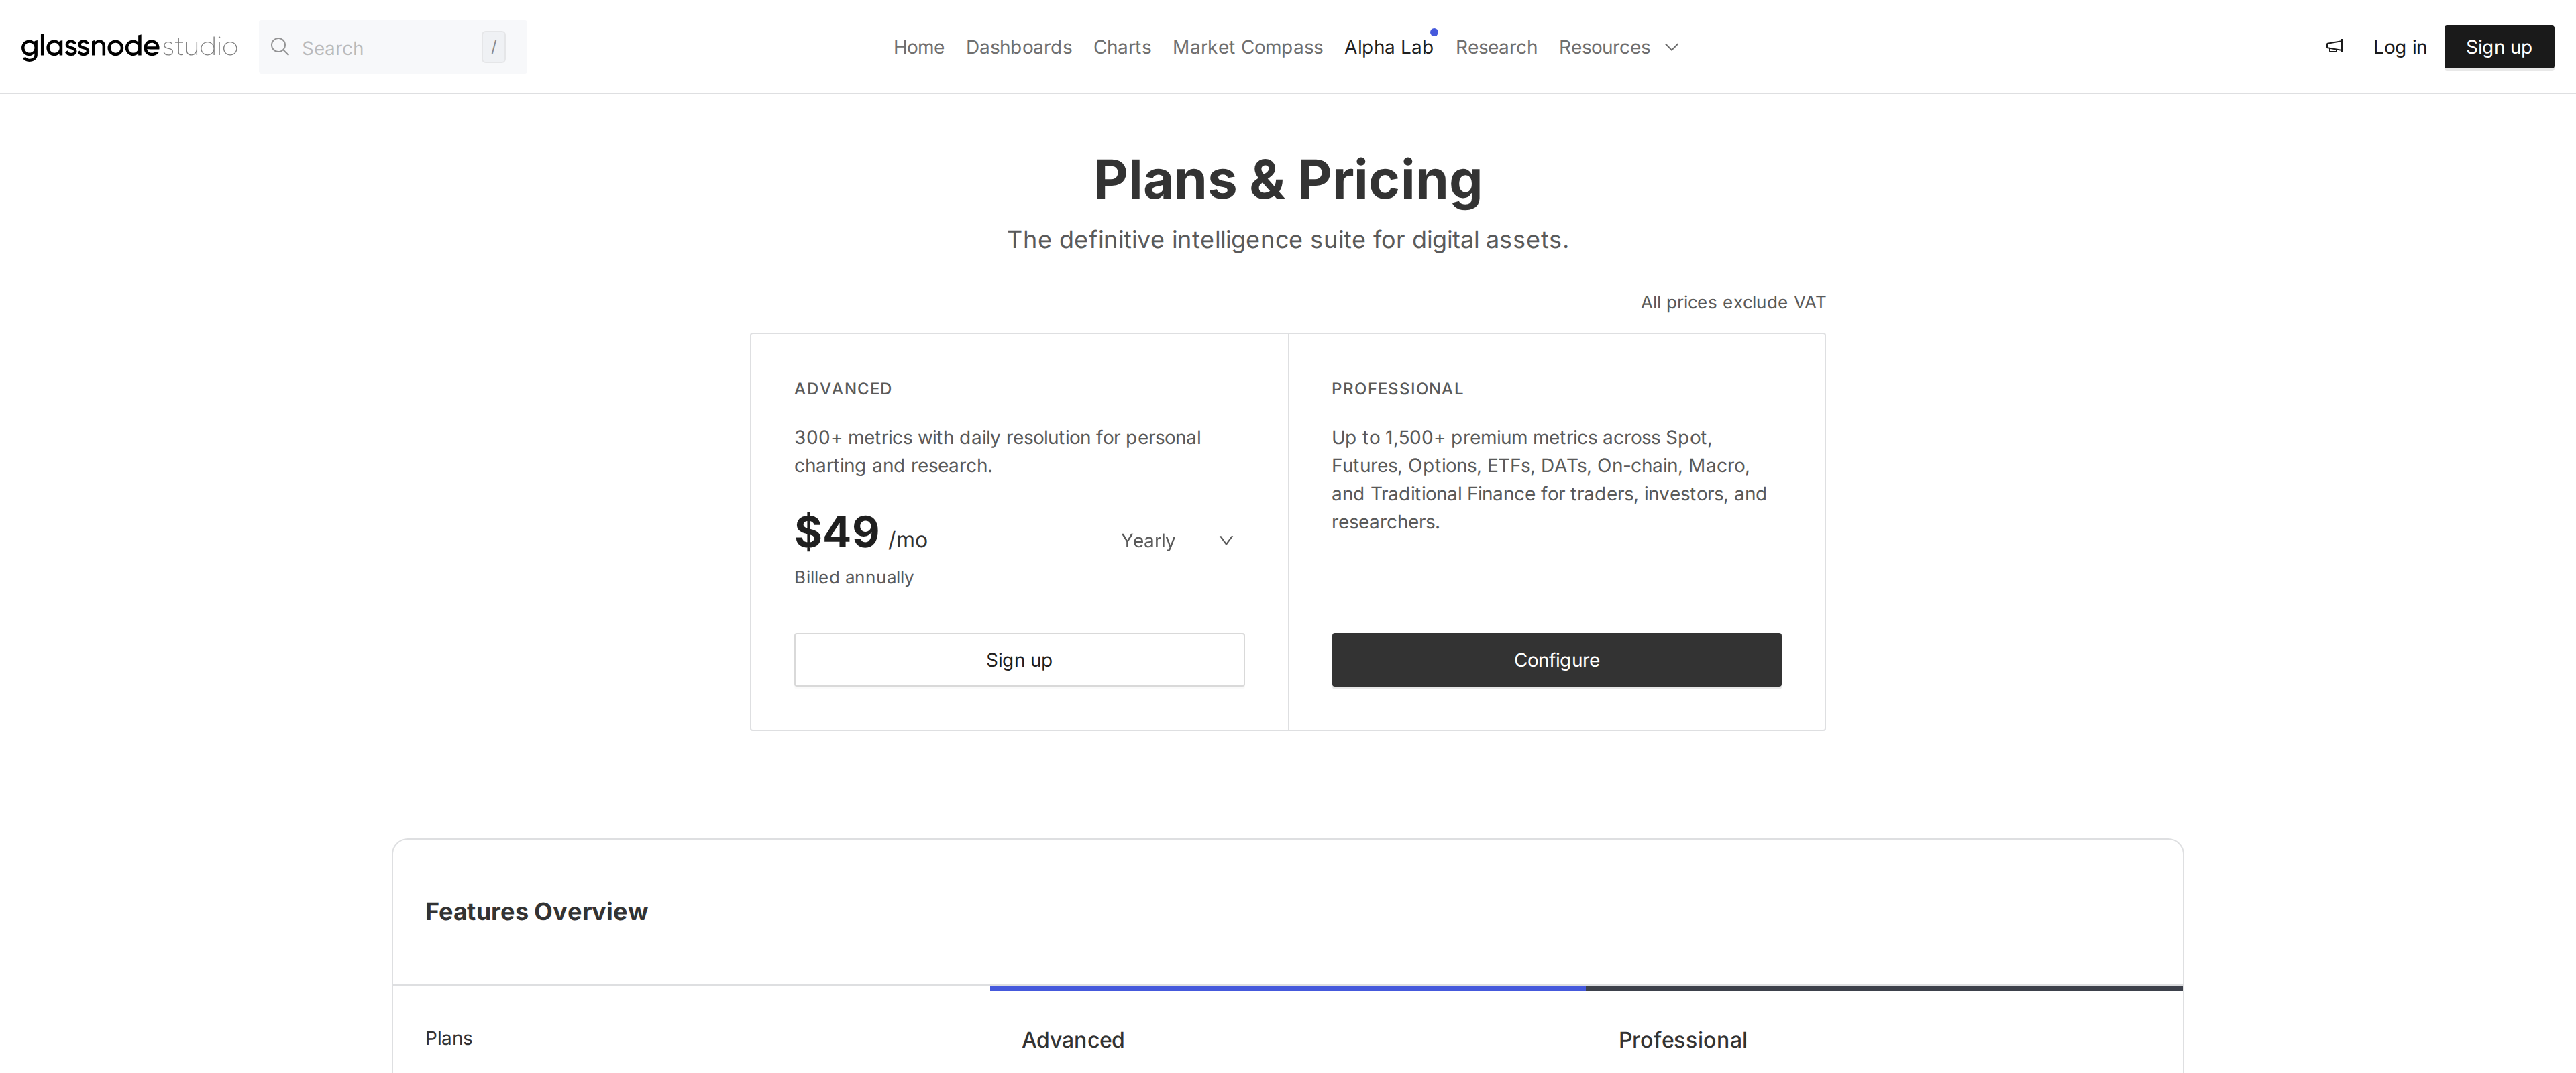
The Advanced plan costs $49 a month billed annually and unlocks 300+ metrics at daily resolution, which is the tier that actually earns Glassnode its reputation. Professional goes further, up to 1,500+ premium metrics and resolution down to ten minutes, but its price is quote-only (studio.glassnode.com/pricing), clearly aimed at a desk with a budget line for data rather than an individual.
Is $49 a month worth it outside a fund
Specifications
- Free access
- Public price/volume charts only, no account required
- Advanced plan
- $49/month billed annually, 300+ metrics, daily resolution
- Professional plan
- Custom pricing, 1,500+ premium metrics, down to 10-minute resolution
- Total metrics claimed
- 1,700+ across 1,500+ assets
- History depth
- Up to 15+ years on select assets
- Data categories
- On-chain, spot, futures, options, ETFs, macro